
Simplified or misinformation – a fine line
The energy debate rages unabated, and the experts should mind their credibility

The Age newspaper recently had an article with the heading, “Battery surge a cheap, green saviour as war fuels price spikes”. The author quoted The Grattan Institute’s Tony Wood and Hamish McKenzie and included some charts. This one got under my skin because I believe the conclusions are arrived at from a massively over-simplified analysis.
Perhaps this is the narrative that sells papers, but an increasing number of people are wondering why if the mainstream narrative was correct, we don’t have the lowest electricity bills in the world.
Below I’ve tried to break this one down into its component parts and add more details.
The first problem is in the headline, and I’m sure many will point out the fact that batteries are not green or renewable. Yes batteries are associated with the renewables industry, but that’s the extent of the hyperbole. Gosh even wind and solar, the bedrock of the renewables industry are not themselves renewable products. The term renewable is confined to the fuel source – sun and wind – which is not renewable it’s just the weather. The fuel source for batteries is other generators (insert cannibal reference here if you wish…!).
Second, what are batteries supposed to be the saviour of? The article makes the claim that batteries are responsible for reducing wholesale prices in the recent past and also in the future by displacing gas turbines and minimising the effect of price shocks caused by the Iran war.
Batteries powered by renewables are pushing gas plants off the electricity grid, proving that green energy will reduce fuel bills driven higher by shocks to the global fossil fuel market such as the crisis being driven by the Iran war.
This is a bold prediction of the future, but AEMO’s gas data hub shows that domestic gas prices are so far unaffected by the Iran situation. Looking further back the domestic gas price has averaged around $12/GJ since 2024. The article subsequently references Q4 2024 and Q4 2025, but there were no fuel price shocks in Q4 2024 or Q4 2025 and gas prices have been stable and even reducing in that time.
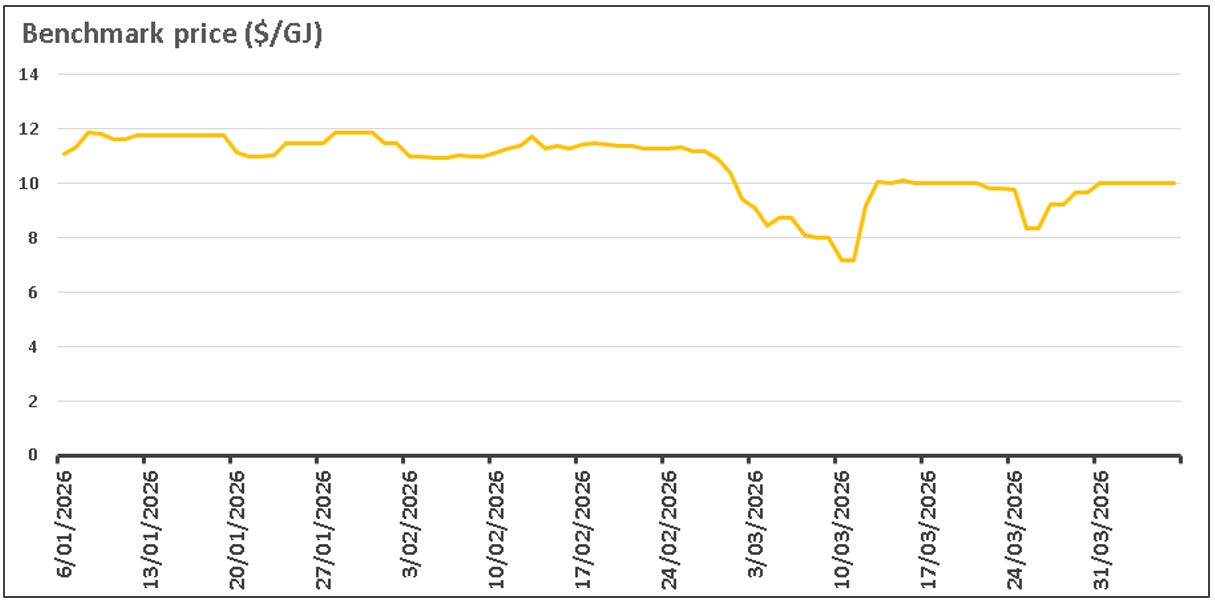
Source: https://www.aemo.com.au/energy-systems/gas/gas-supply-hub-gsh/data-gsh/data-dashboard
Those fine-tuned to identifying misinformation may also be triggered by the line batteries powered by renewables. South Australia is regarded by advocates as a renewable utopia and should be a good reference to check if batteries are actually powered by renewables.
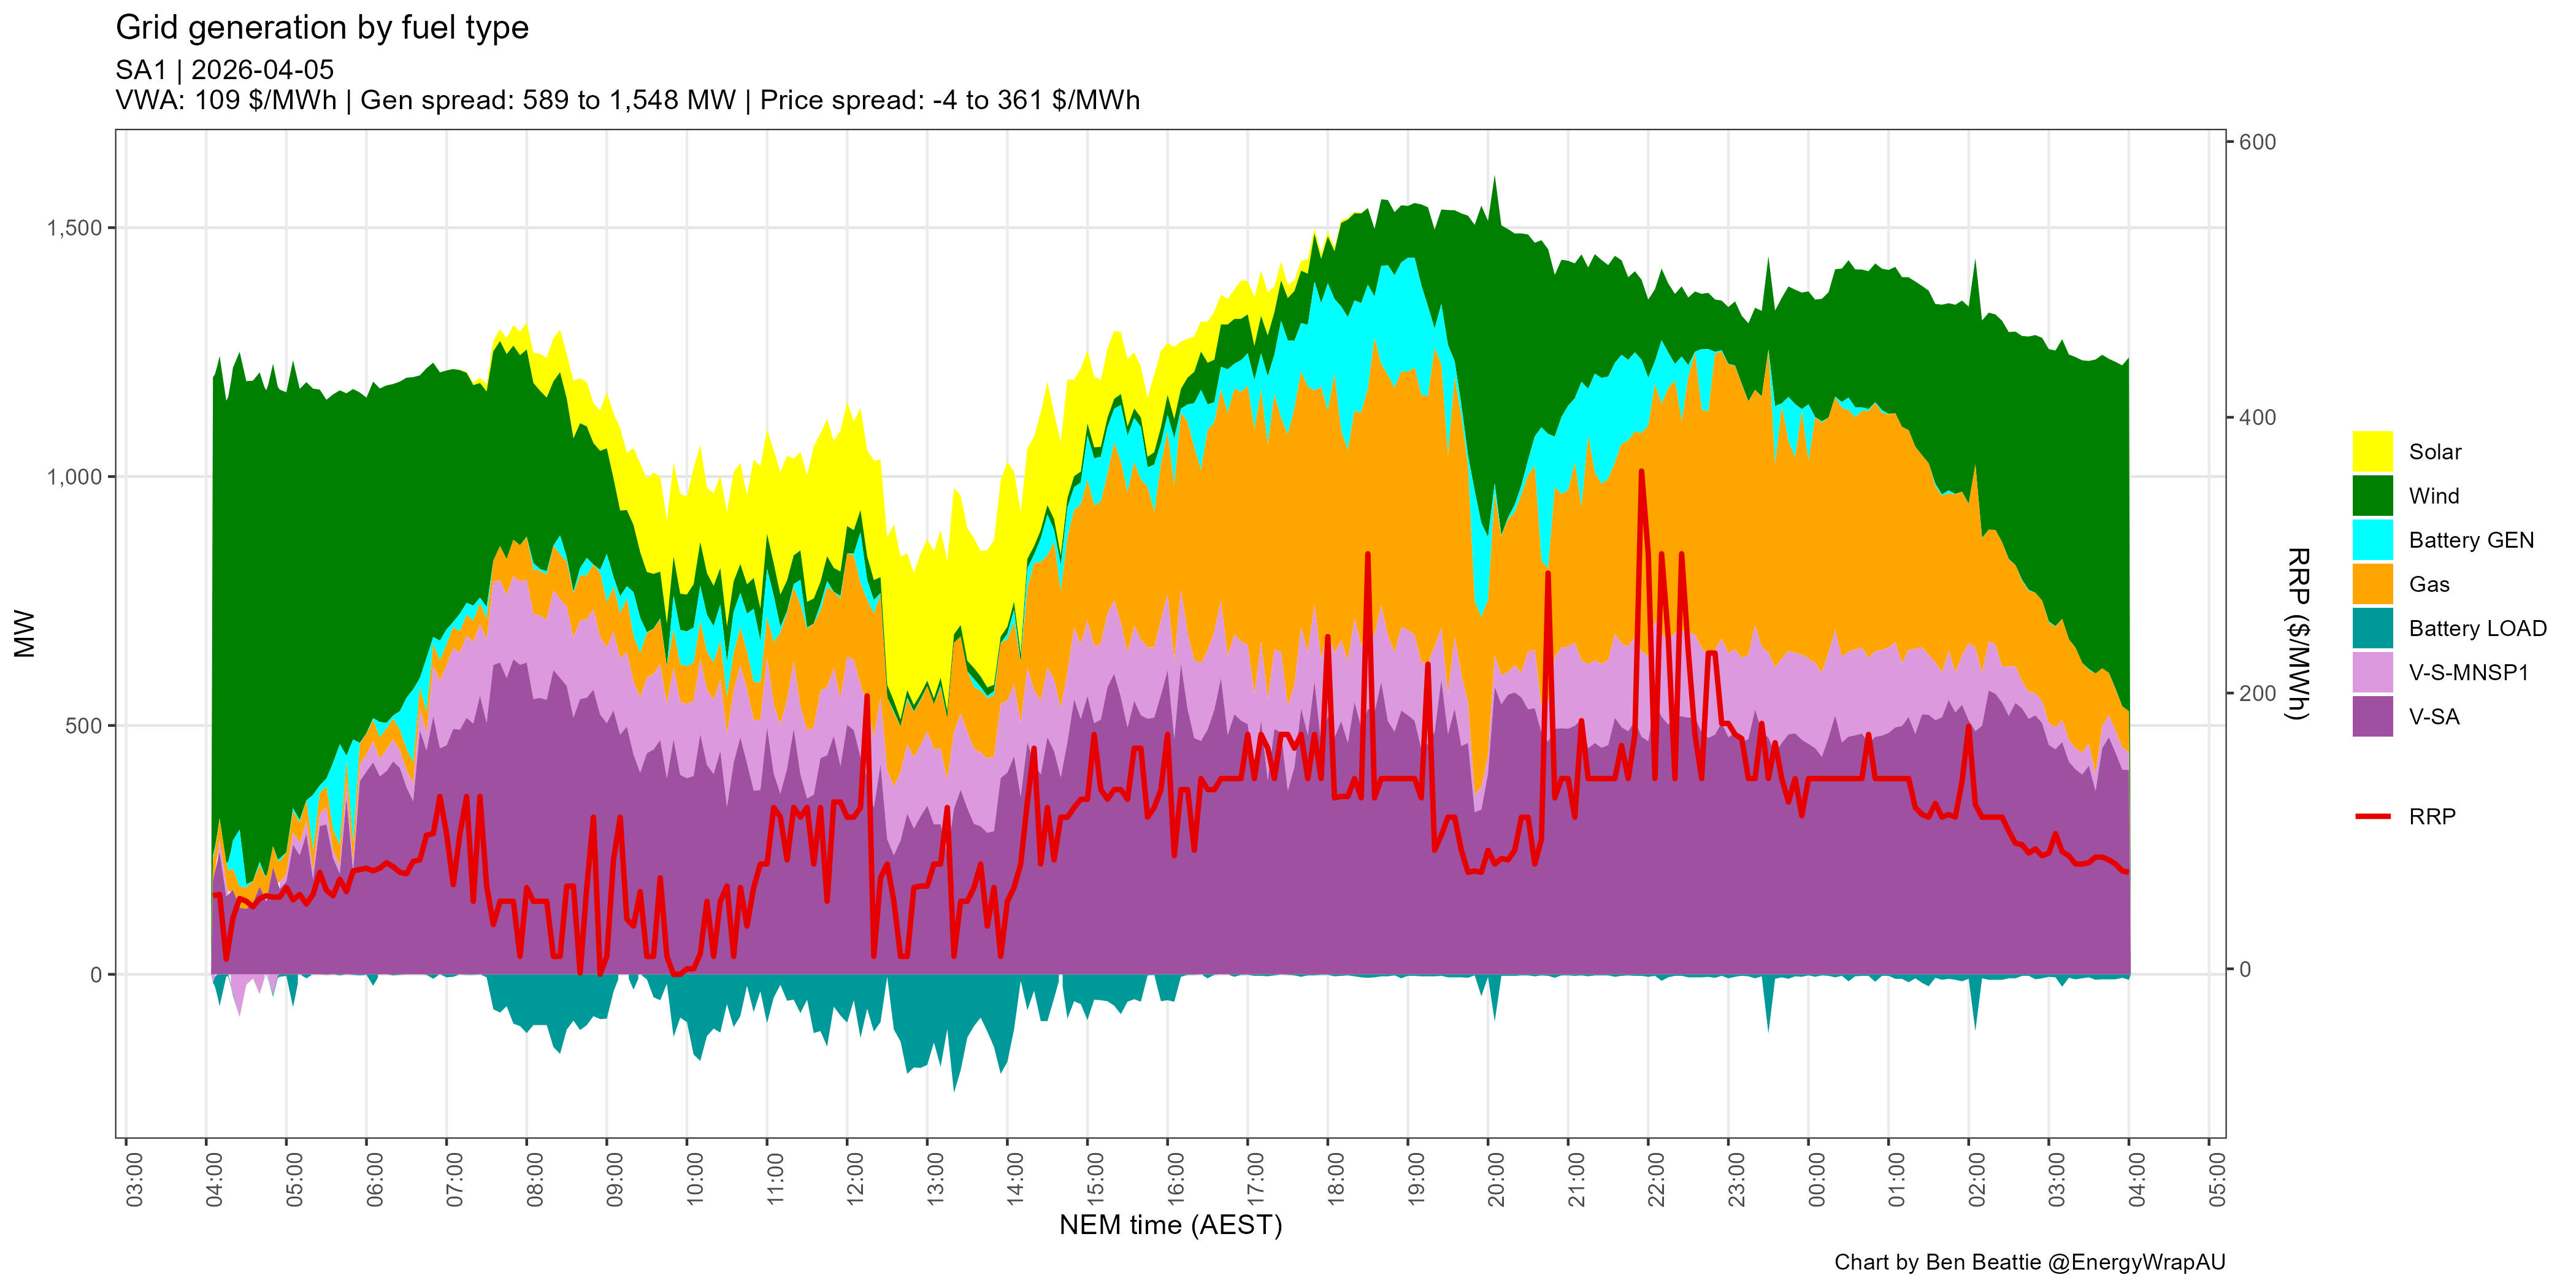
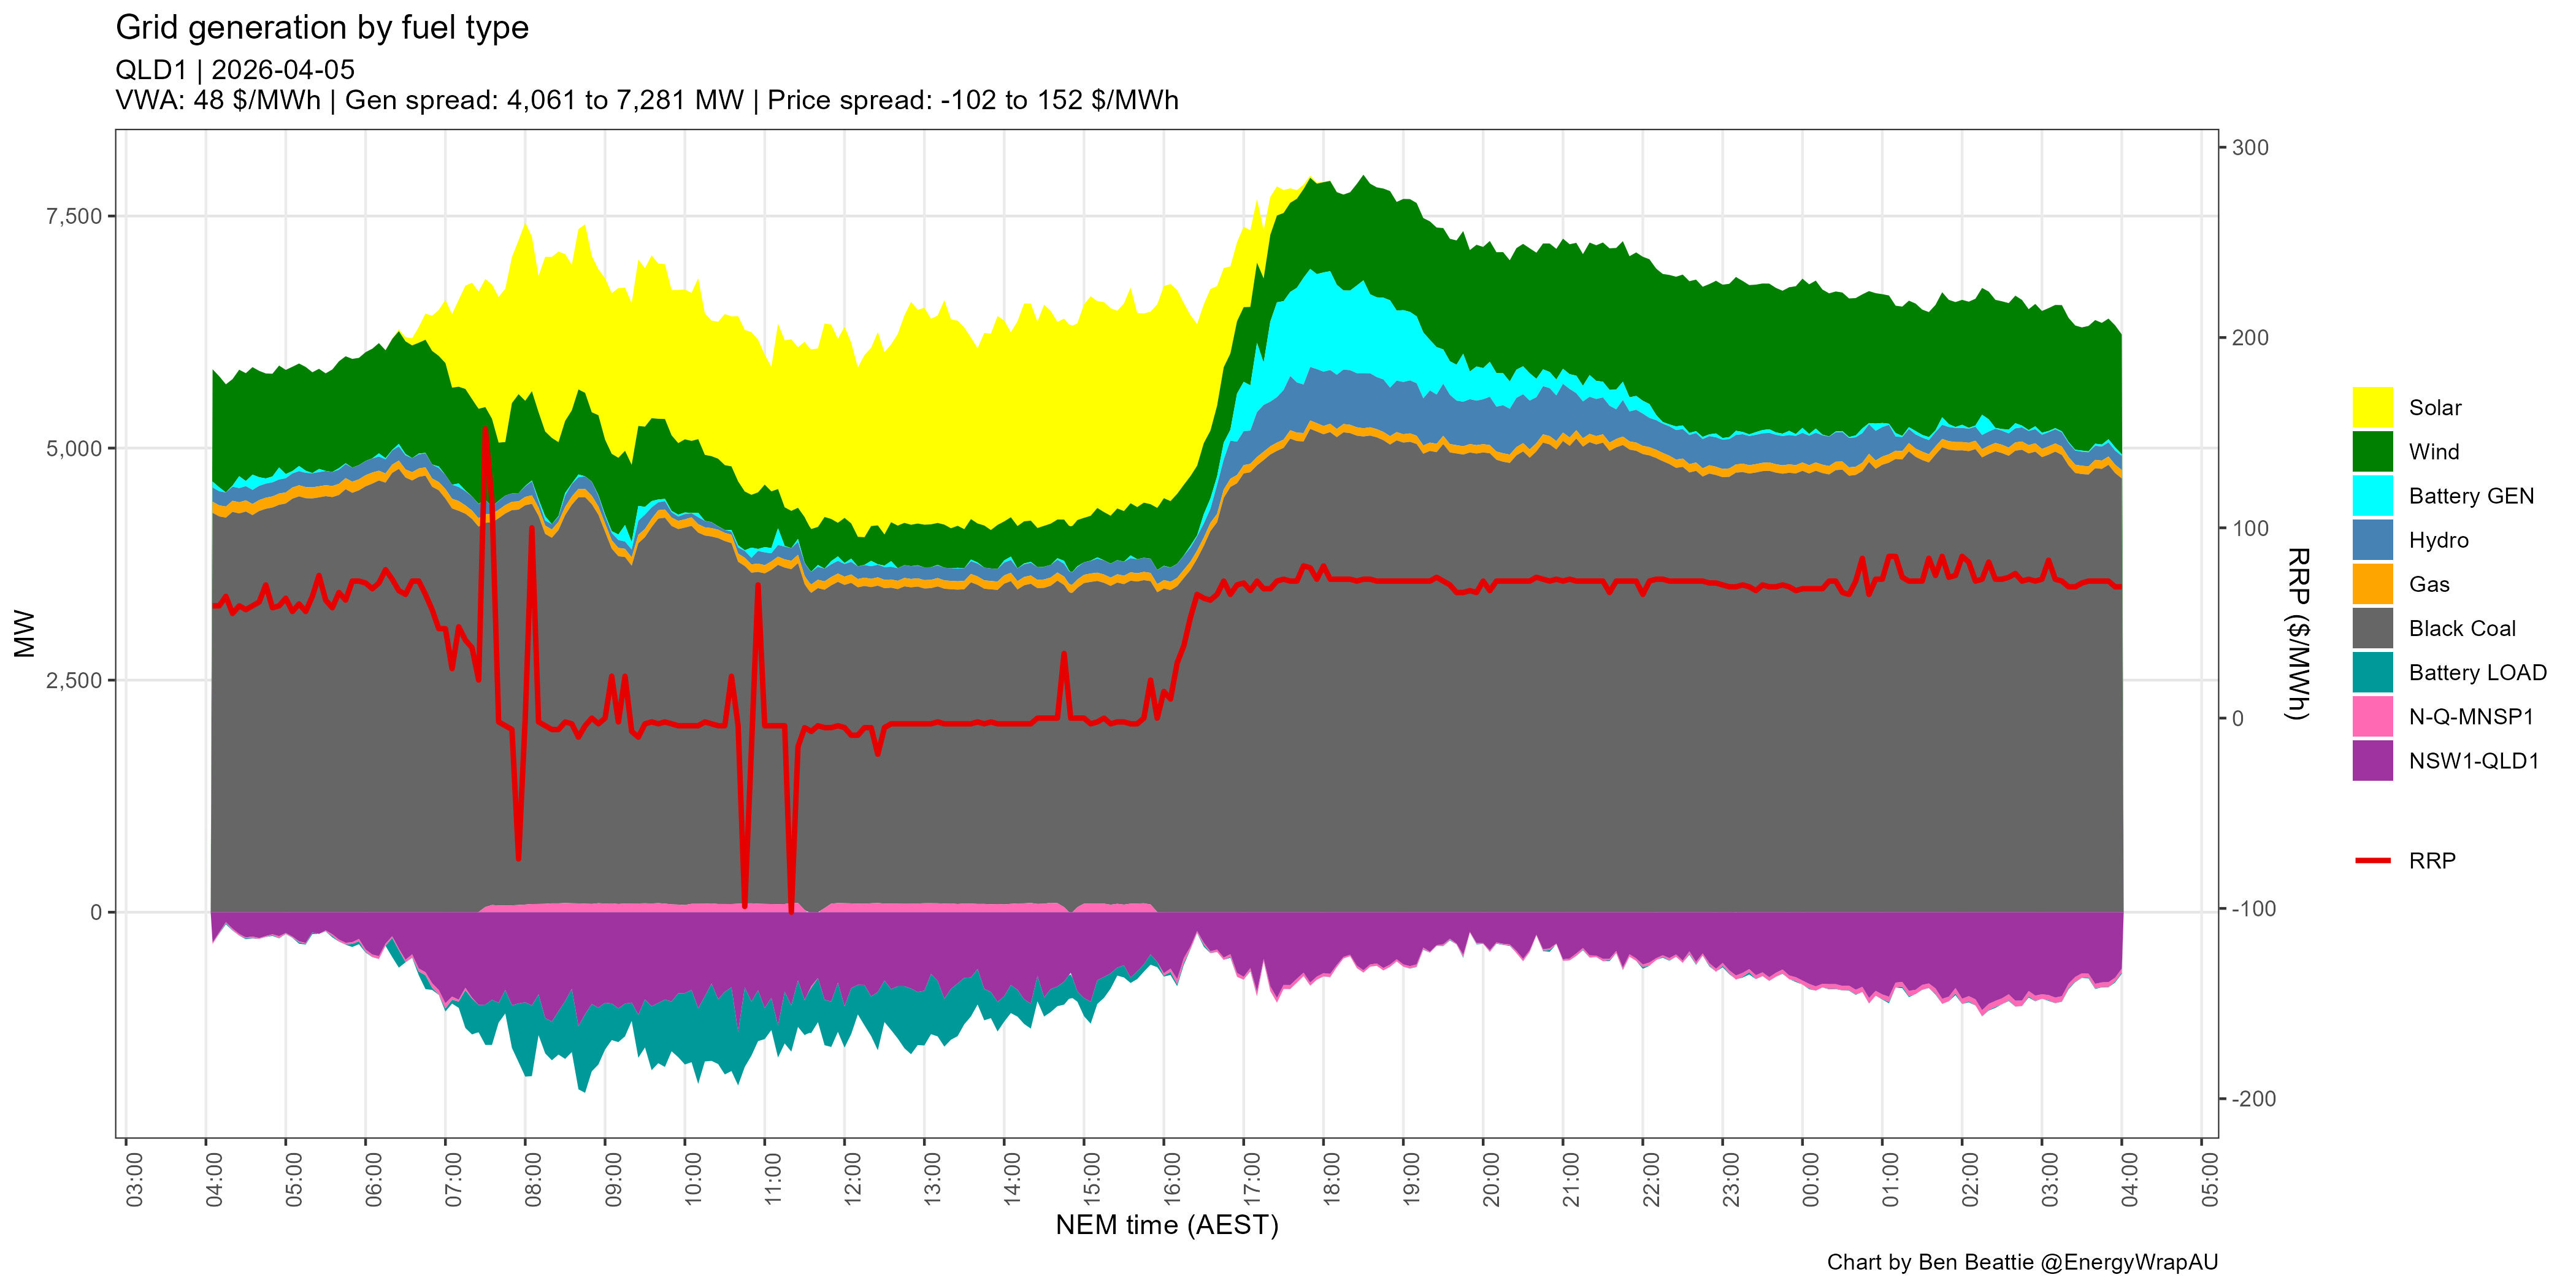
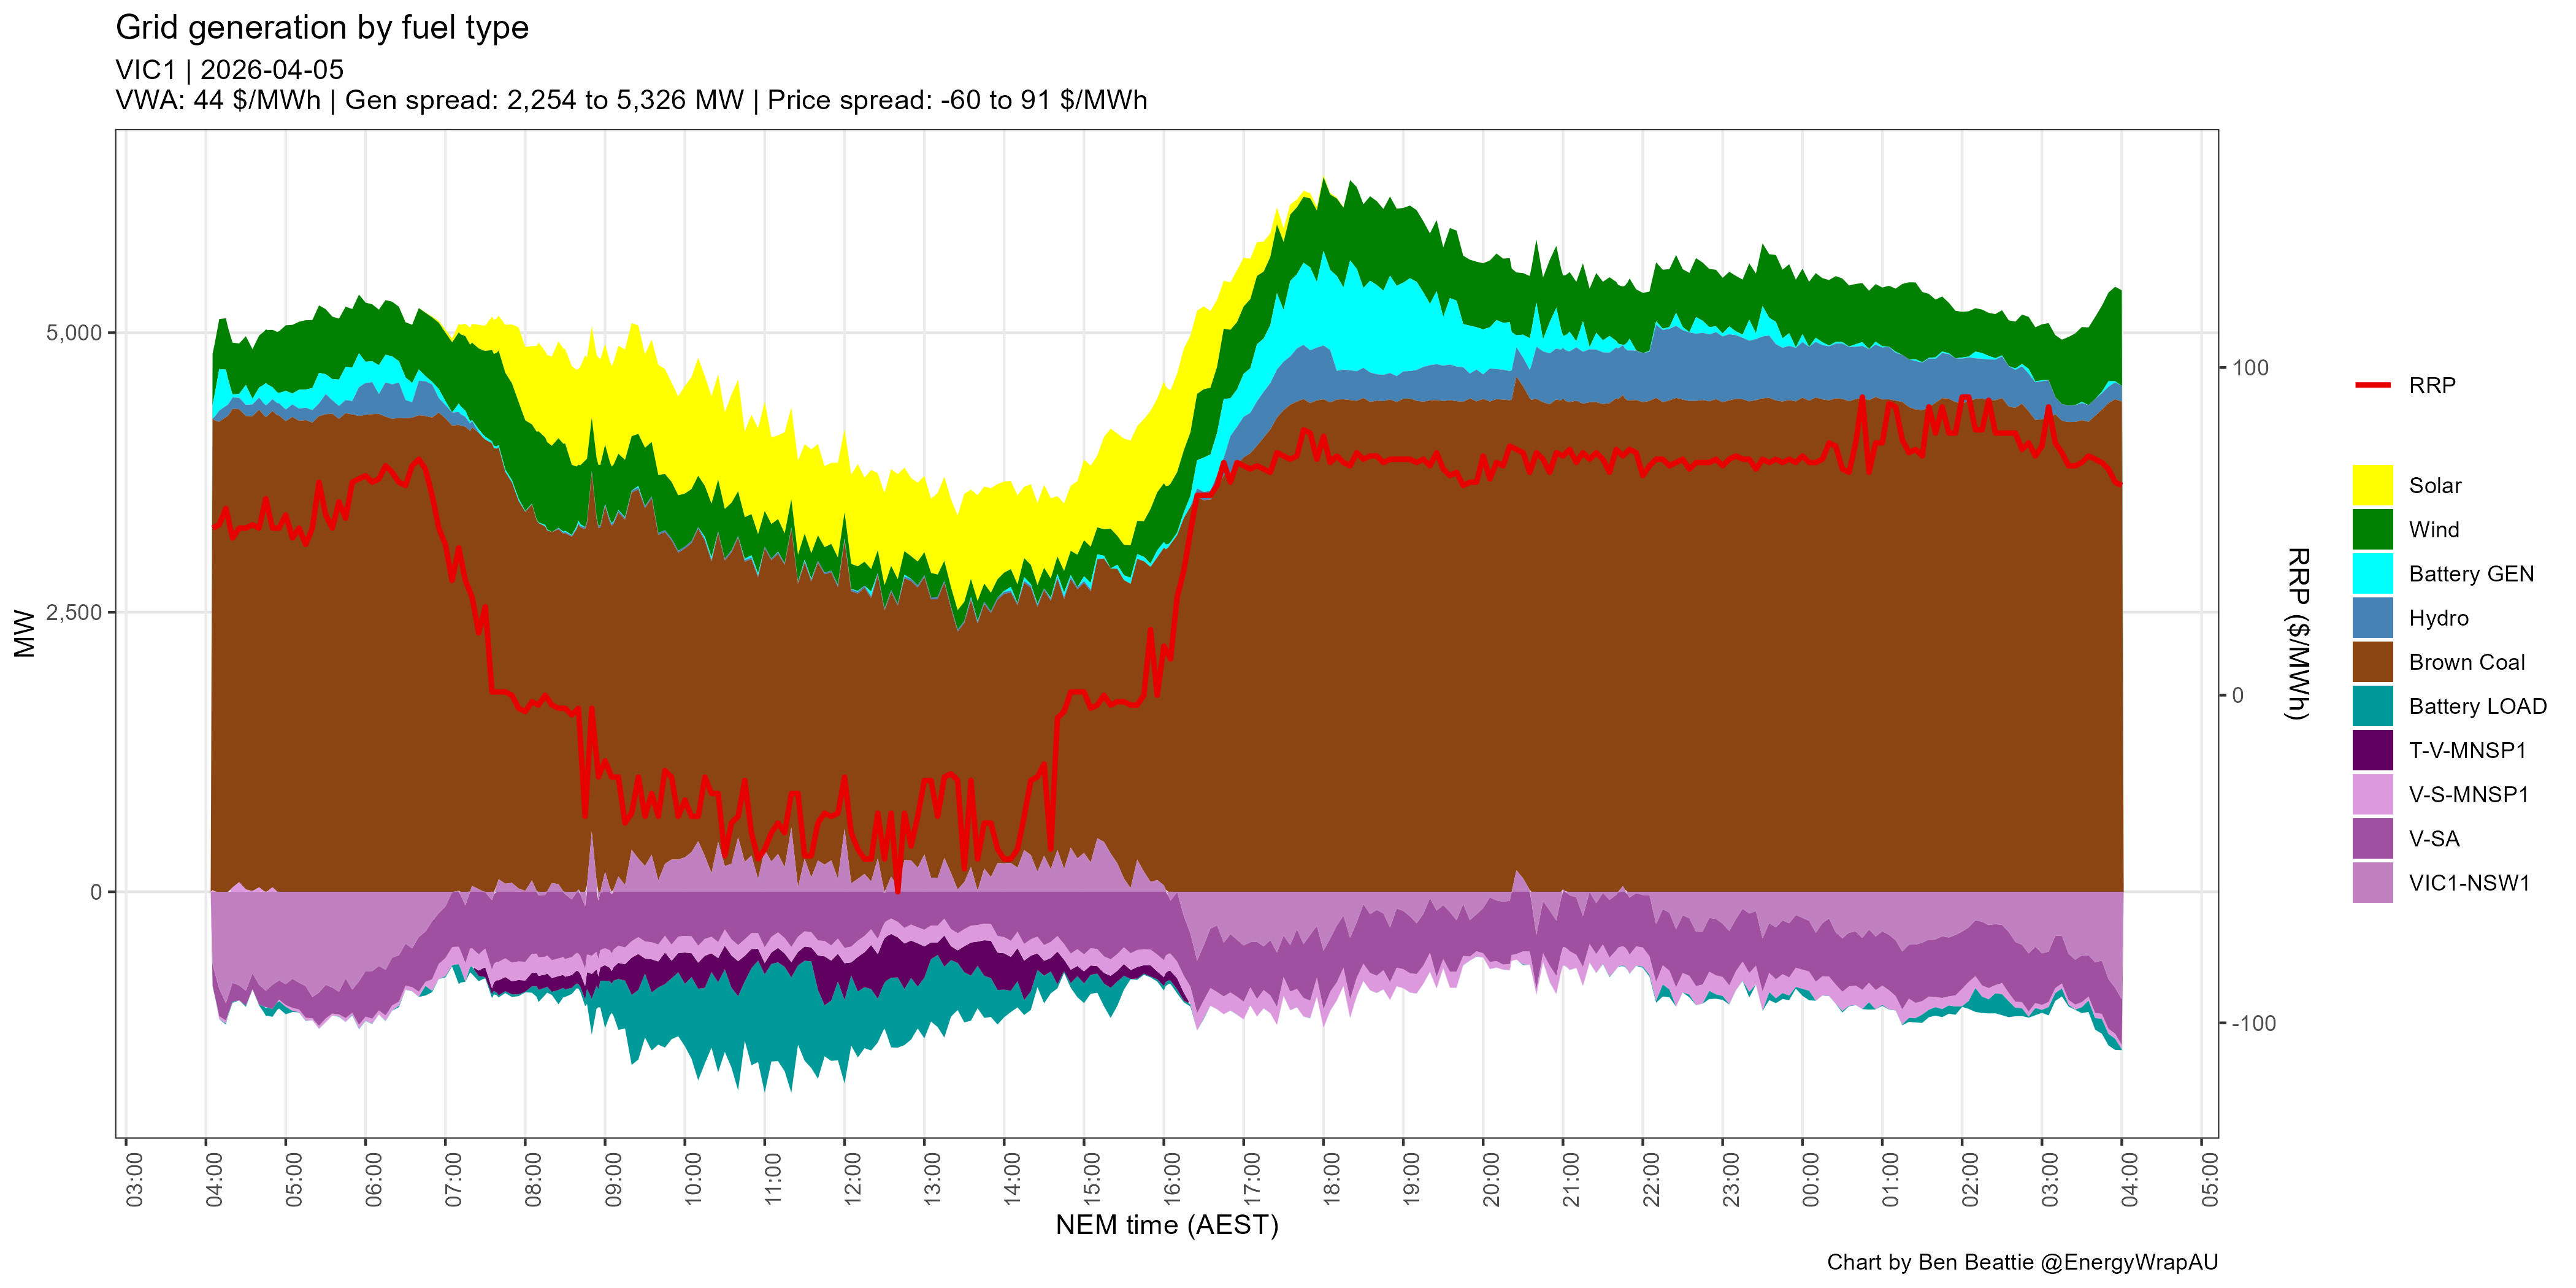
This chart shows the SA grid generation mix on 5-Apr-2026 (excluding rooftop solar). The teal colour below the line is combined battery charging and the cyan colour is battery discharging.
It is not difficult to see that even when batteries charge in the middle of the day the grid supply is not always all renewable. On this day in particular there were significant imports from VIC – mostly coal – indicating SA’s rooftop solar capacity was not producing much at all. The obvious truth is that grid batteries charge from whatever the grid mix is at the time. Advocates will say batteries are charged from rooftop solar as well, which is true only as far as the percentage of total supply on the grid. Few mention that rooftop solar mostly curtails industrial solar projects.
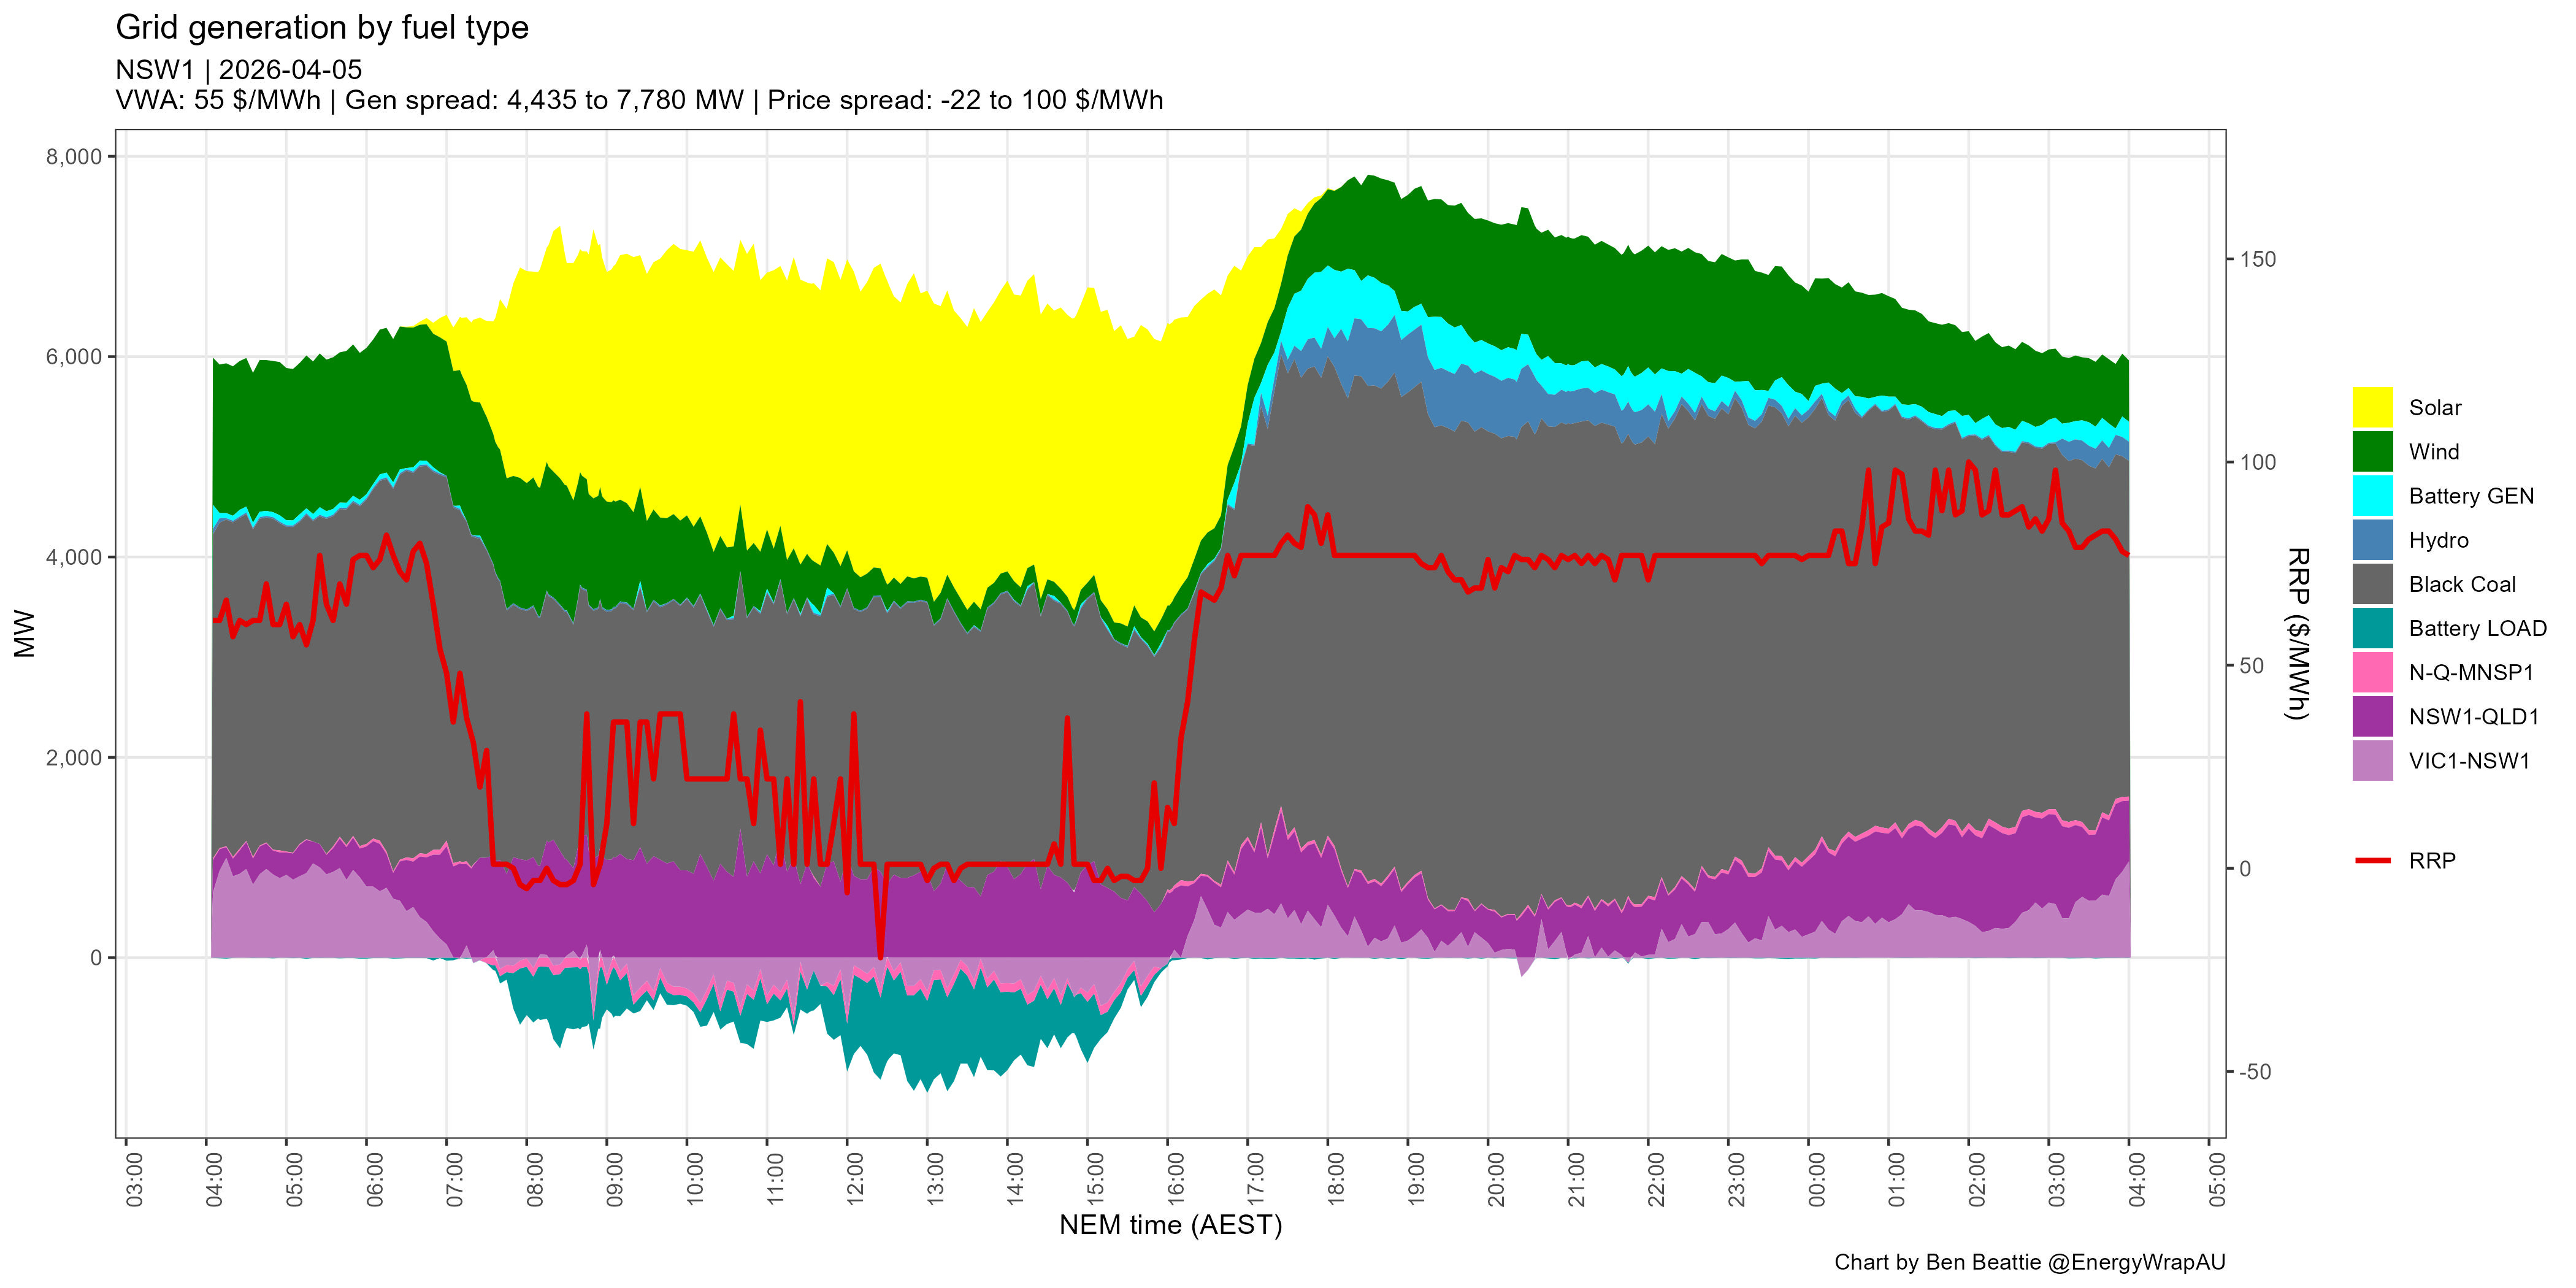
New South Wales, Queensland and Victoria show similar results for the same period.
Batteries… are pushing gas plants off the electricity grid may be the only defensible argument made in the article, and charts from The Grattan Institute are used to support the claims.
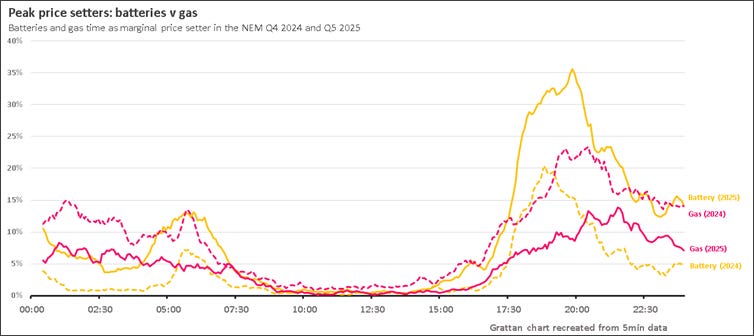
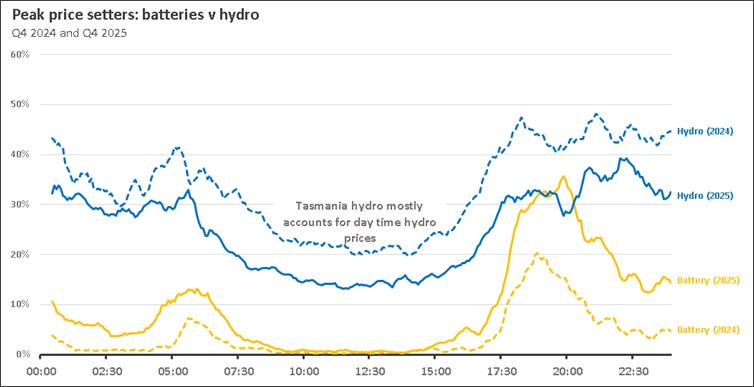
Grattan’s first chart shows the average proportion gas and batteries set the wholesale price at each time of day in the NEM. In the analysis below I have taken the liberty of borrowing Grattan’s fancy layout.
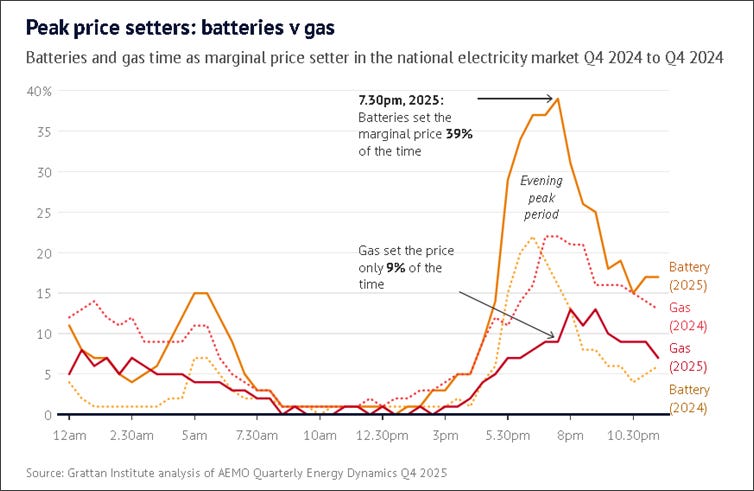
In the evenings of Q4 2024 gas and batteries set the price about an equal proportion of time, but in Q4 2025 batteries set the evening peak prices more often. I got close enough to the same result as Grattan’s chart using AEMO 5min data.
At this stage we can all agree that more batteries coming online in 2025 were competition for other generators, including gas. But Grattan failed to mention other peaking plant like hydro. The same comparison shows hydro output is also down in 2025, not something the emissions reduction cheerleaders make much noise about.
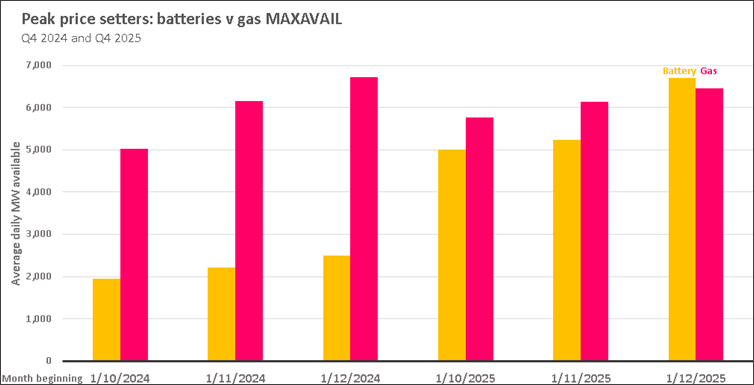
When we plot the average capacity of gas and batteries made available to the market per month we can see the significant increase in batteries.
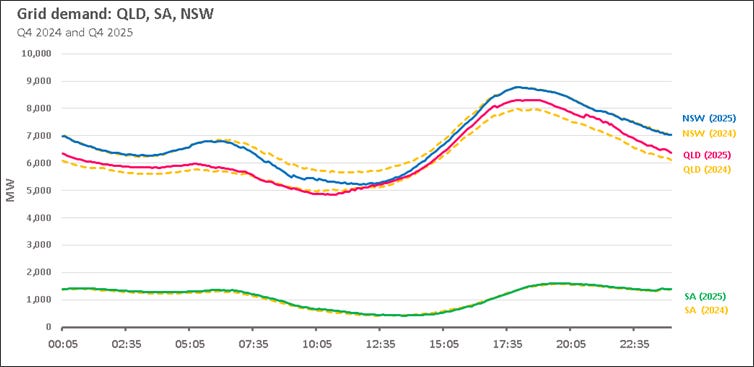
What about demand? Minor increase in QLD evening demand, minor decrease in NSW daytime demand. Nothing obviously responsible for any significant price deviations, at least not in this time of day perspective.
What about price? There is no Grattan analysis on price except this from Grattan’s deputy energy director Hamish McKenzie:
If you are an electricity generator, and you can choose between dispatching your gas and your batteries, of course you would dispatch your batteries first, because you can do it for free as opposed to paying expensive prices for your gas.
McKenzie’s statement is guaranteed to elicit a tribal response, and it is no surprise that he’s a former policy advisor for Climate 200 backed teal Helen Haines.
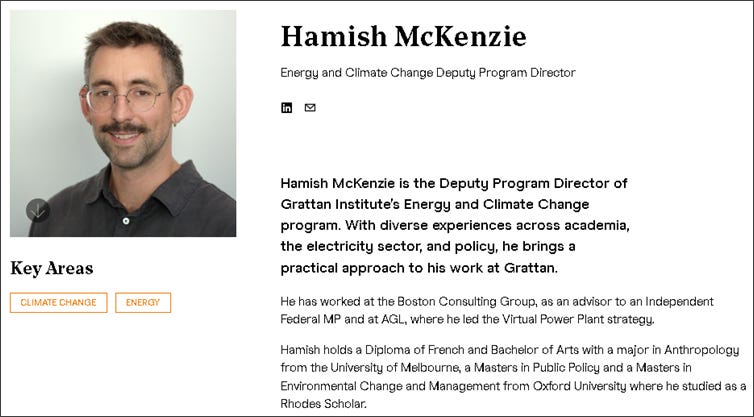
Source: https://grattan.edu.au/expert/hamish-mckenzie/
I suppose if you believe battery output is free, it follows that batteries must reduce prices! Below I present the wholesale prices from the reference periods.
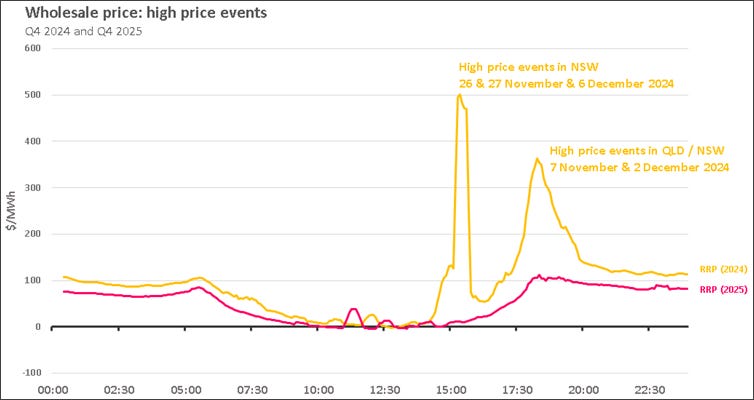
We can see that wholesale prices were generally higher in Q4 2024 than Q4 2025. But the lower prices occurred across all timeframes, not just when there was ‘free McKenzie output’ from batteries in the evenings. If batteries are the saviour wouldn’t prices more closely reflect when batteries were operating?
It turns out that Q4 2024 suffered from significant price volatility, and details on these price spikes are captured in excruciating detail in the AER’s high price event reports.
https://www.aer.gov.au/publications/reports/performance/prices-above-5000mwh-october-december-2024
Keeping in mind this is NEM-wide data (averaging softens the spikes), the price spikes occurred mostly in NSW and QLD for short periods in a small number of days. The AER explains that several coincidental changes caused high spot prices – among them coal planned and unplanned outages, transmission constraints, and low wind output – but gas and batteries were barely mentioned.
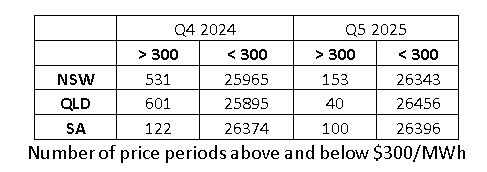
To dig deeper into the price effects I’ve interrogated the NSW price setters: filter for gas and batteries, sort into price buckets above and below $300/MWh, calculate the proportion of each.
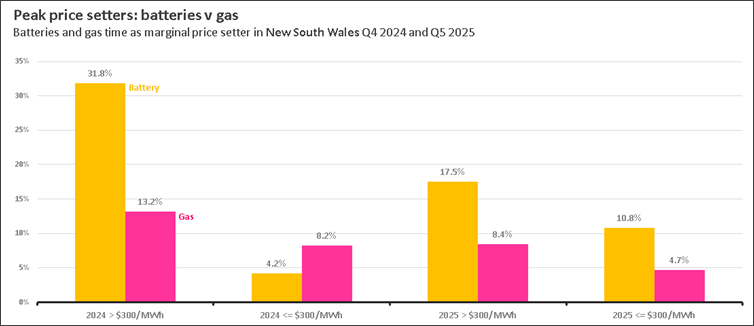
We can see that in Q4 2024, when the NSW spot price settled above $300/MWh, batteries appeared more than gas. This result seems counter-intuitive but remember this is the smaller set of prices over $300/MWh. In Q4 2025 batteries again set more of the high prices in NSW than gas.
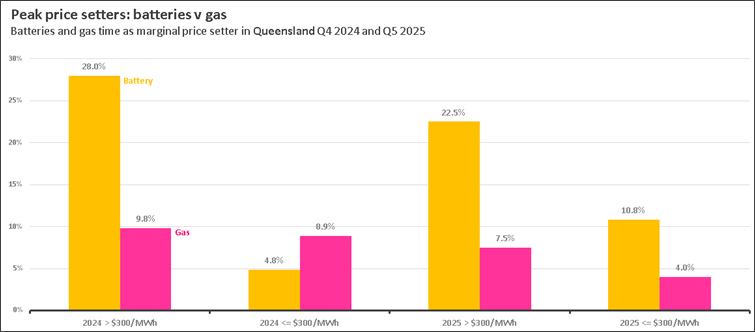
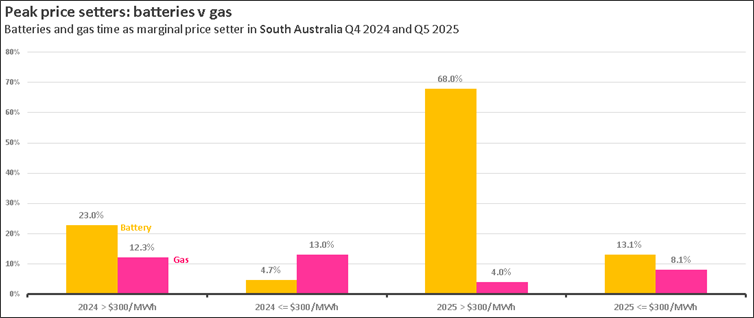
Shifting to the prices below $300/MWh we can see a reversal where batteries set the low prices more often than gas in 2025. Similar patterns appear in both SA and QLD where the reversal is occurring in the 2025 sub $300/MWh realm.
Does all this tell us much? Not really, except there’s more to understanding the system than an oversimplified time of day analysis averaged across multiple states.
Even the numbers I’ve presented above hide much of the real information. For example in Q4 2024 QLD had 601 price periods above $300/MWh, but in Q4 2025 had only 40. So when the chart shows batteries set the high prices 22.5%, that’s 22.5% of just 40 price periods, while batteries set the low prices in 10.8% of 26,456 price periods.
One of the main shortcomings of the Grattan analysis is showing data averaged across the entire NEM. This masks differences in each state as we’ll see below.
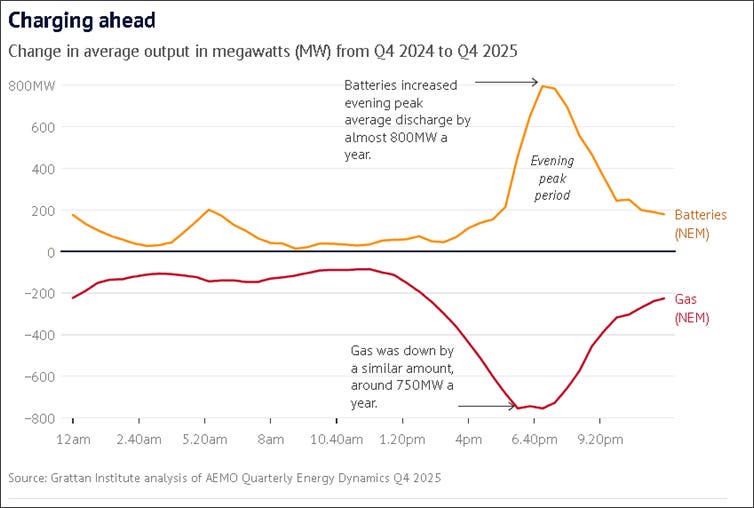
In the second chart referenced in the article, The Grattan Institute repeats the time of day strategy but on this occasion subtracts 2024 output from 2025 output for both gas and batteries. If 2025 output is greater than 2024 output the result will be positive, and vice versa. The Grattan result shows a dramatic correlation between increased battery output and reduced gas output.
I did the same for each state and the picture changes significantly.
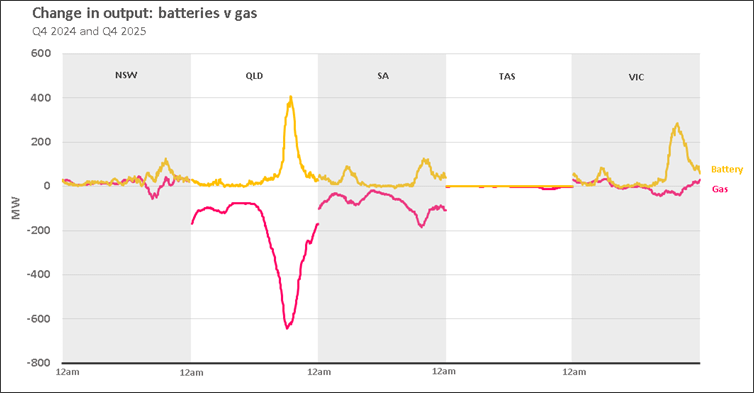
We can see that Grattan’s chart is primarily influenced by Queensland with almost 2,000 MW of grid battery installed. There is some correlation in South Australia (800 MW) as well, but the story is less compelling in Victoria (1,800 MW) and New South Wales (1,100 MW). Tasmania is typically irrelevant in most energy analysis (Sorry TAS…!) and has no grid batteries installed so far.
In conclusion, it’s not cherry picking to take the average results across the National Electricity Market, but it is misleading to claim NEM-wide results when 90% of that result only exists in Queensland in one quarter.
And Danielle Wood ex Grattan now heads the Productivity Commission. The march continues....The Austrslia Institute......another policy feeder
Thanks for sifting the wheat from the chaff Ben. We need clever guys like you to lead us into better long term energy decisions.