
Battery pack
What is the collective noun for renewables cheerleaders?

It’s that time of the energy season when roving packs of renewables advocates claim responsibility for low wholesale prices, regardless of the underlying reasons. The piece we’ll look at here is from a pair called Newman and Wills from Western Australian academia published in RenewEcomedy January 2026.
In December 2025 they co-authored a similar piece in The Conversation about batteries in WA and the website version included this disclaimer:
Peter Newman receives funding from the Reliable Affordable Clean Energy CRC.
Ray Wills advises clients within the clean energy sector through his business, Future Smart Strategies. This article did not receive specific financial or in-kind support.
No such disclaimer was provided by RenewEcomedy.
The pair’s thesis covers the well-worn territory that renewables are great and batteries are about to kill off fossil-fuelled generators. Ironically just a few days later Origin announced that Eraring power station would continue to operate into 2029 well beyond the 2025 closure date flagged in 2022. Even the most cynical commentator must now acknowledge that keeping one of the most expensive coal-fired generators in the NEM online appears cheaper than supplying customers with power from new industrial wind and solar.
Before we get into the nitty gritty of the Newman-Wills analysis, it’s worth noting they did not mention retail electricity prices. Regular readers will recall my arguments about the supply chain, and that even if renewables are able to suppress wholesale prices for some periods, the total system cost inevitably increases with subsequent effects on retail bills.
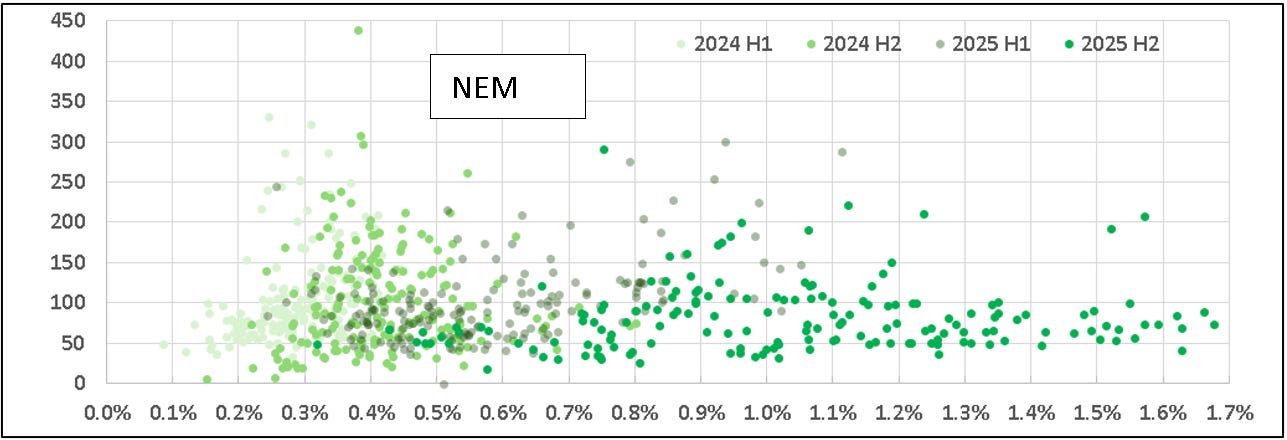
Newman-Wills begin with a chart comparing combined NEM daily average wholesale price against the daily proportion of battery output.
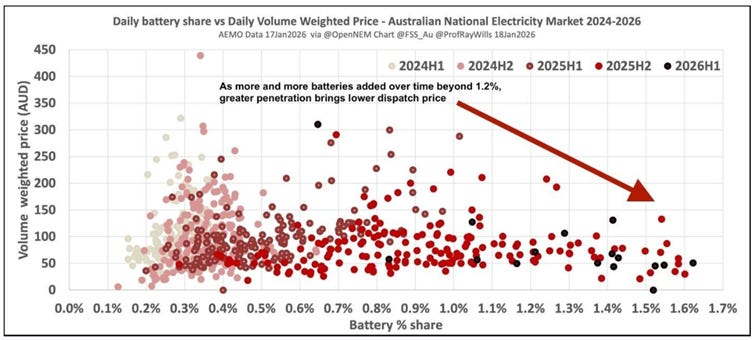
With some minor quibbles about exactly which days are included in the original data I was able to reproduce their chart with reasonable accuracy.
Newman-Wills:
“…market prices frequently exceeded A$200/MWh… due to limited storage capacity and a heavy dependence on gas for peak supply and system firming.”
They claim the correlation shown in their chart proves more battery output reduces wholesale prices. That might convince the least curious among us, but there are several inputs into wholesale prices and comparing one small contributor across all NEM regions provides zero insights into price setters or market conditions.
Direct comparisons with 2024 are misleading as 2024 was an unusually high-cost year that suffered from several significant price spikes. AER reports discuss the primary drivers.
“Prices above $5,000 per MWh continued to have an impact on overall prices, particularly in Q1 and Q2 2024. The causes of the high prices varied between regions, but involved some combination of high demand, network and generator outages, and lower wind and solar output.”
The AER’s conclusion is far removed from ‘limited storage and dependence on gas’.
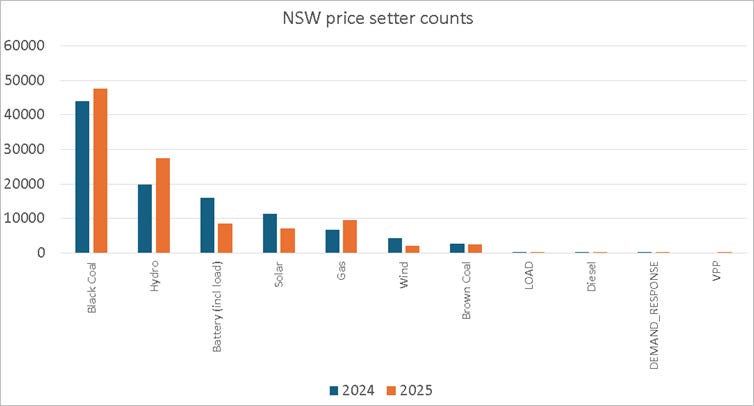
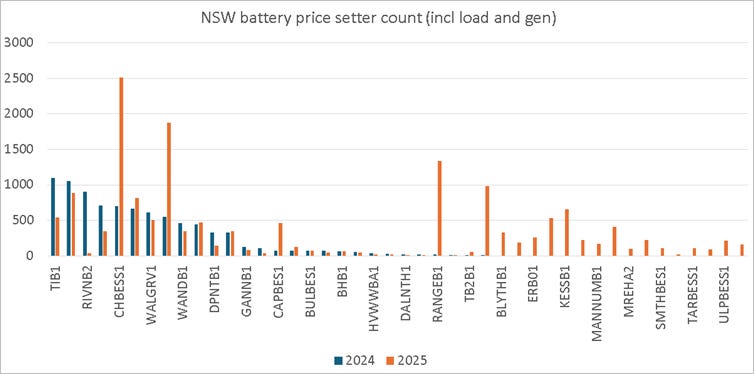
AEMO releases a price setter database each month and with some work it can be shown how often each fuel type sets the price, which region the price setting unit is located, and the fuel type of each.
Recalling that NSW average 2025 prices were lower than 2024 some uncomfortable facts appear in the data:
- coal, hydro and gas all set the price more in 2025
- batteries set the price less in 2025
Clearly there are more to wholesale prices than a simple correlation with one technology averaged across all regions.
My take? There’s a possibility that greater availability of coal combined with greater competition among batteries for the remaining market share suppressed wholesale prices.
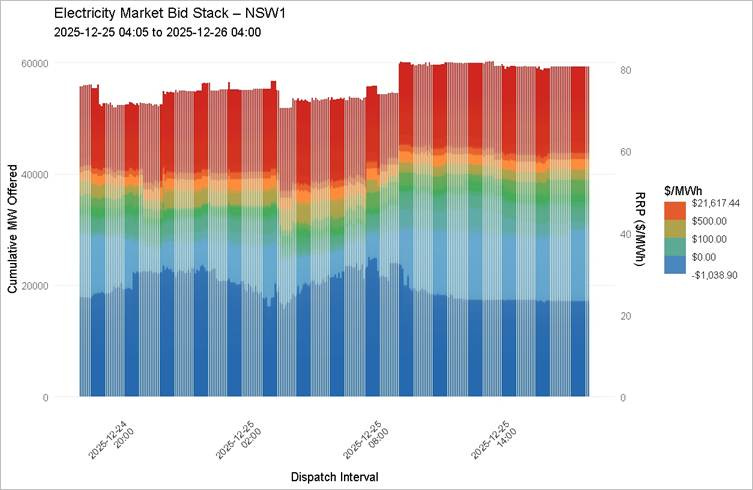
It is tempting to point out that in NSW 2025 when industrial wind and solar set the price it averaged below $20/MWh. That’s very low and demands two important caveats – PPA and VWA.
PPA is power purchase agreement which guarantees a fixed price for generator output. There are variations but this generalisation is close enough. It is safe to say there are no industrial wind and solar plants earning below $20/MWh from a PPA.
VWA is volume-weighted average prices which relates the price to the generation volume, providing deeper insights into effects on total price.
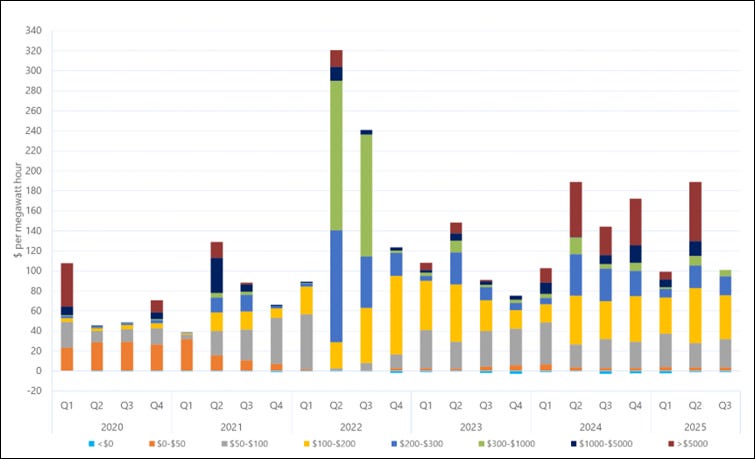
In the chart above each colour is a different band of wholesale prices and the height shows the contribution of each price to the quarterly volume weighted average price. Add them together vertically and you get that quarterly average.
Barely visible along the bottom in cyan is the collective impact of wholesale prices below $0/MWh – it’s not much. That’s because when the wholesale price is very low, the grid generation output is also very low. Very low $/MWh x very low MWh = a small number and small effect on quarterly average price.
In contrast the price bands above $100/MWh have a much greater impact on the quarterly average price. High prices almost always occur when grid generation is high during peak demand periods. High $/MWh x high MWh = a large number and large effect on quarterly average price.
Quarterly average price is important because most wholesale electricity is sold quarterly.
VWA is simple to calculate with just three columns in a spreadsheet. If you put $/MWh for each time period in column A and the MWh for the same periods in column B, when you multiply A and B and store the result in column C you get $. Once you have that then VWA = sum(column C) / sum(column B). This gives you $/MWh again, but as a volume-weighted average for the data series.
Newman-Wills go on to make the same price vs output correlation for renewables they made for batteries.

I had less luck reproducing this chart. I got a similar pattern but not the same spread, even trying different combinations of what constitutes ‘renewables’. The closest I got was by including rooftop solar, industrial wind and industrial solar.
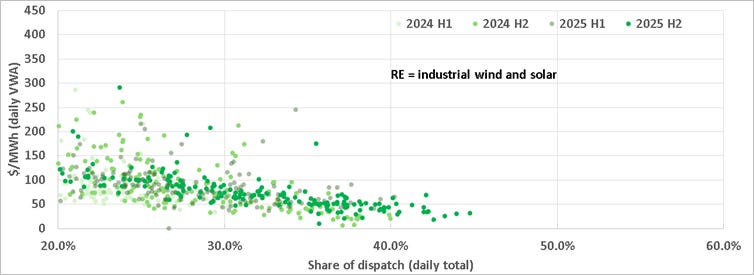
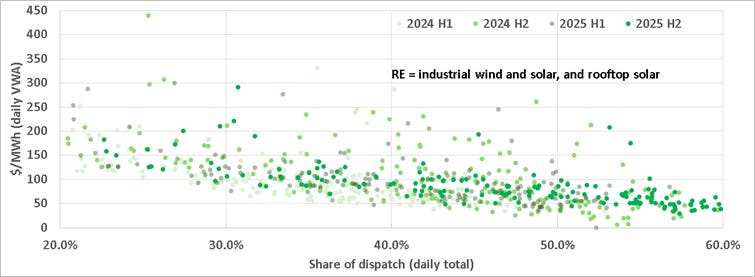
Newman-Wills draw the same conclusion from this correlation as they did from batteries.
“The data shows a clear correlation: higher battery penetration leads to reduced prices and fewer price spikes.”
But they fail to say why. Their thesis is simply ‘more RE/battery means lower prices’. To verify that claim they should be able to show exactly how ‘more RE’ makes the wholesale market set at a lower price. We’ve already seen the price setter data which shows fewer prices set by batteries and more by coal for lower prices in 2025.
If they cared to pursue their theory further they’d discover that prices are set each 5min by the intersection of the demand curve and the bid stack. Their theory might go on to say that more low-cost generators fills the bottom of the bid stack thus causing the supply curve to intersect the bid stack at a lower price.
The NEM price setting concept is stylised in the graphic below.
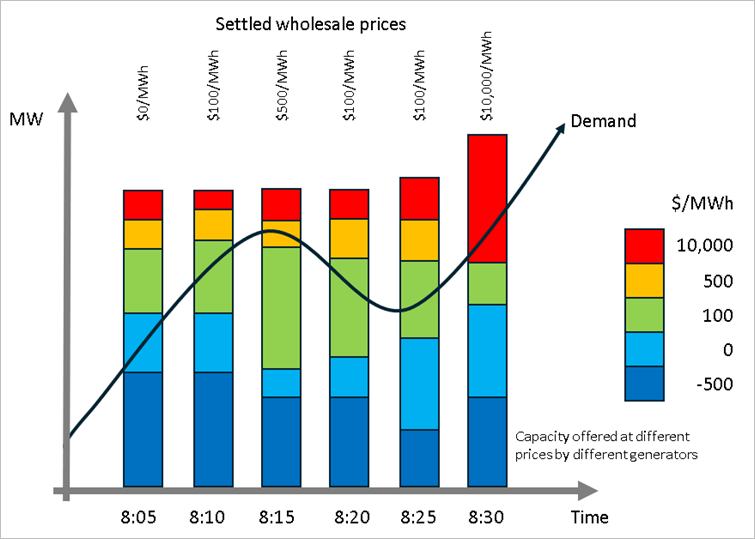
It can be seen that for the demand curve to intersect the bid stack at a lower price, there needs to be a lot more capacity offered at lower prices, all the time. The trouble is with renewables is that it is not always available. The sun doesn’t always shine – that’s a real thing.
The pair used another price vs share correlation to claim that gas-fired generation played a lower role in price setting in 2025.
“…gas is being squeezed out of the mix and now plays a much smaller role in price setting.”
This is flat out wrong as shown by the price-setting data presented earlier. In NSW gas set the price 40% more often in 2025 than in 2024. While total gas consumption for power generation is trending down in QLD the picture is more complex in other regions and even trending up in VIC, NSW and SA.
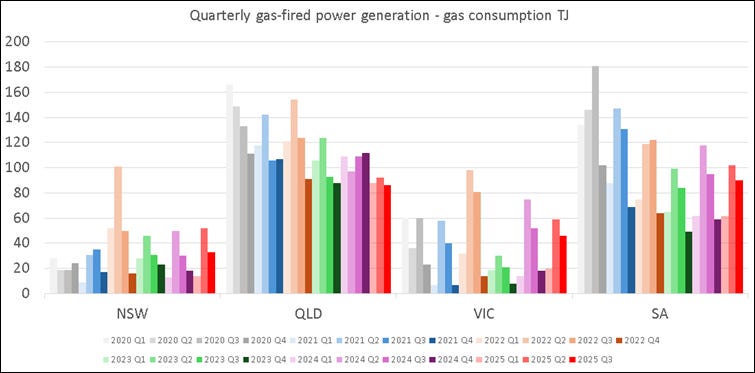
Source: https://www.aer.gov.au/industry/registers/charts/average-daily-gas-used-gas-powered-generation
Newman-Wills continue their analysis with a chart showing longer term trends of renewables and other generators. Surprising nobody, the trends show renewables increasing and other generation reducing.
Their summary is another unsurprising back slap for renewables.
“Since 2024, rapidly increasing battery installations have driven down prices and sidelined gas by enabling renewables to set the market price more often.”
My summary is obviously different.
2025 wholesale prices were generally lower than 2024, but the generation mix that resulted in these lower prices had more coal and gas, not less. Batteries increased in output but set prices fewer times. Any serious analysis about settled prices must acknowledge these facts, not ignore them in order to glaze renewables and receive backslaps from social media cheerleaders.
I think it’s true that more batteries can suppress supply and price volatility, but only for short periods when there’s also enough dispatchable capacity to cover demand. That genuine competition will make the demand curve intersect the bid stack at a lower price point. As soon as a coal unit is not available the battery (or gas or hydro) will set a higher price.
There’s another caveat – charging. A battery’s fuel cost is the wholesale price. Yes that’s usually negative, for now. But more batteries means more demand for MW at negative prices, and inevitably means less of them. If batteries can’t charge cheaply, they can’t sell cheapy either. And once we get there, the batteries will no longer be a price suppressor.
In today's AFR "..potentially put downward pressure on power bill"
https://www.afr.com/policy/energy-and-climate/big-batteries-oust-gas-in-transformational-grid-overhaul-20260121-p5nvvv
Remind me to check back in two years and see where we at. Somehow I doubt it.
Also, correct me if I'm wrong, but I don't believe that battery's can provide 'inertia' ?
Highly doubtful and against every other datasets. In any case, the proper metric for baseload is availability under worst conditions, the not ideal ones. https://open.substack.com/pub/kclapp/p/the-texas-freeze-an-early-update?utm_source=share&utm_medium=android&r=17bedn